Enhance Your API Monitoring with Zuplo’s OpenTelemetry Plugin
We're excited to announce the release of our OpenTelemetry plugin, designed to help you collect and export telemetry data from your Zuplo API efficiently. Currently, the OpenTelemetry plugin implements tracing, with metrics and logging support planned for future releases.

Tracing with OpenTelemetry#
Tracing is a powerful tool for monitoring performance, identifying bottlenecks, and troubleshooting issues in your API. The OpenTelemetry plugin automatically instructs your API to collect trace data, which can be sent to any OpenTelemetry-compliant service such as Honeycomb, Dynatrace, Jaeger, and more.
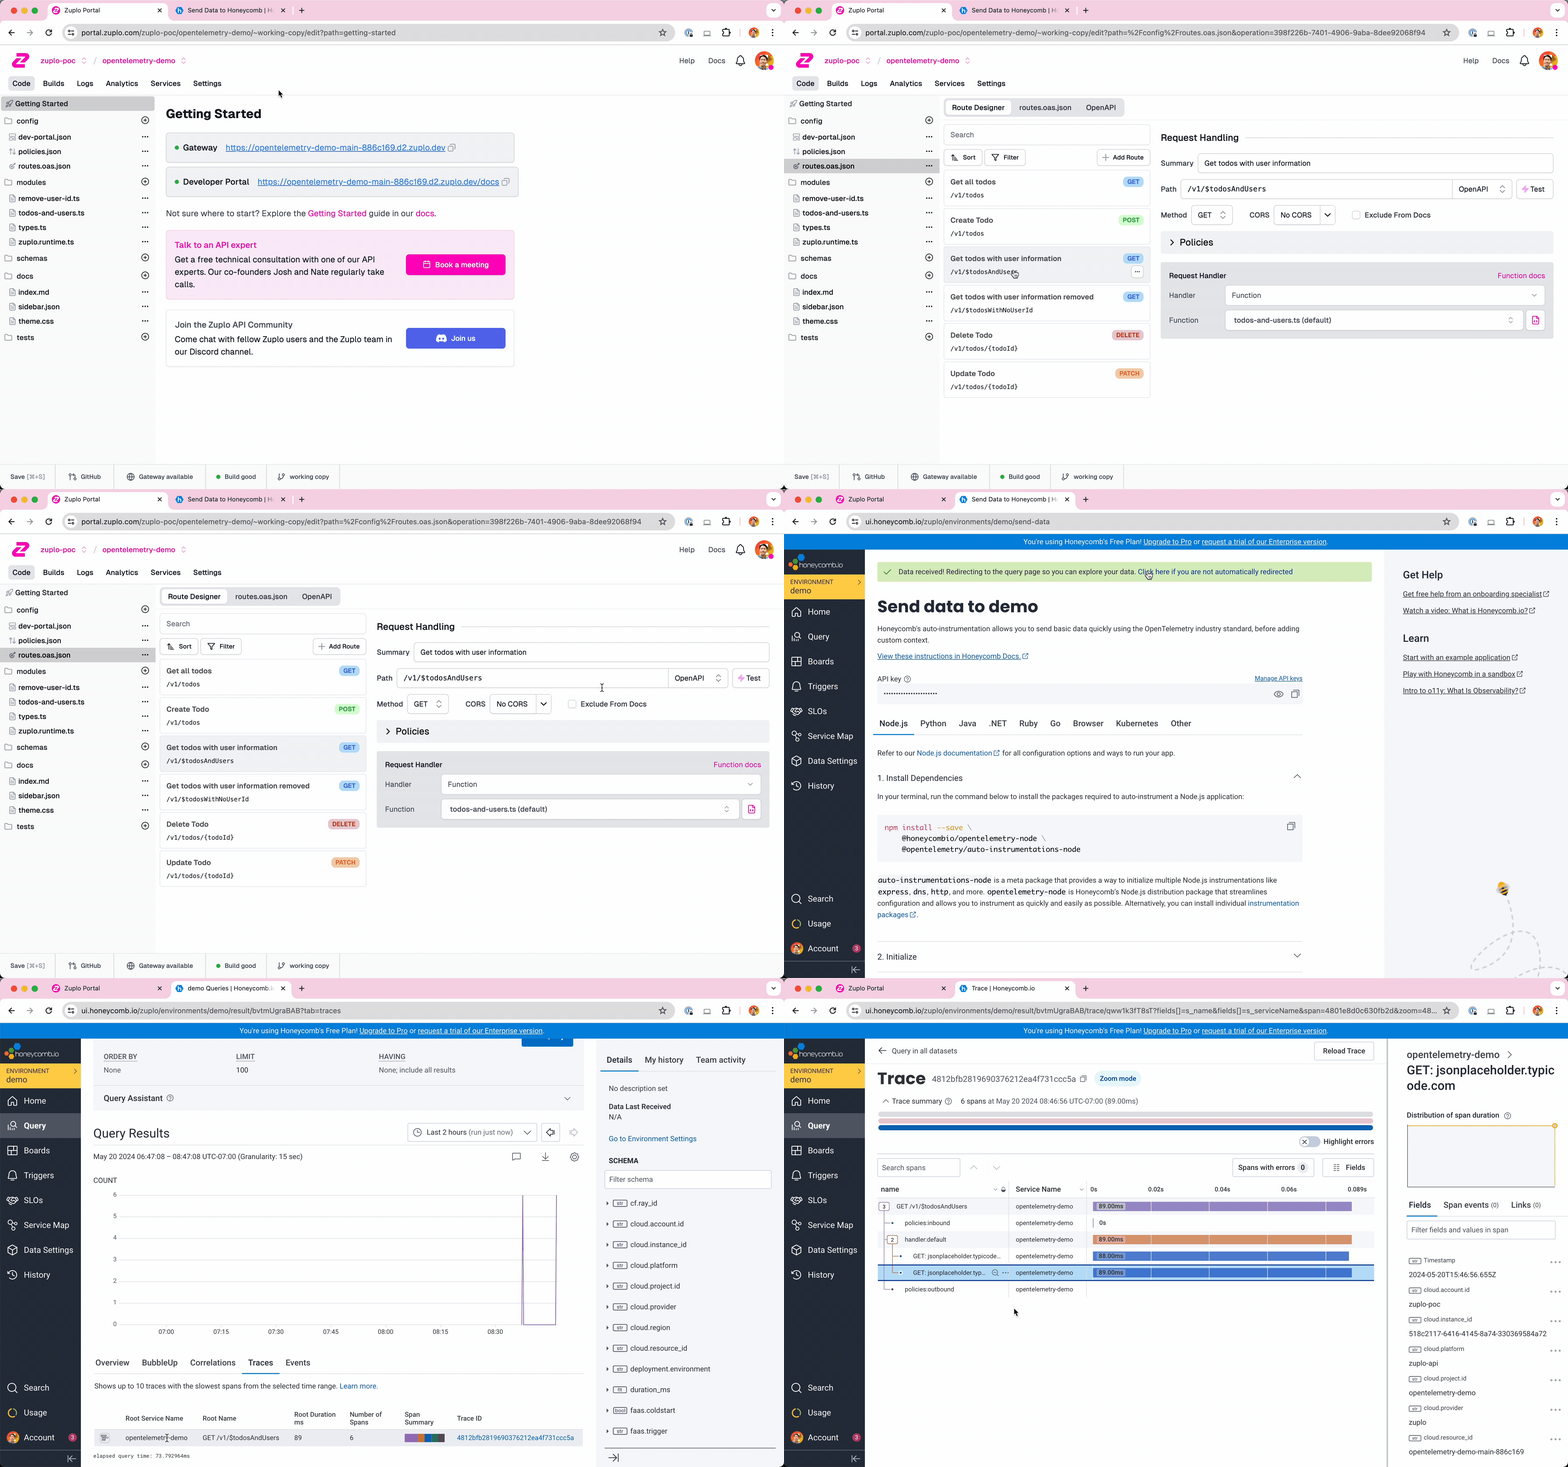
When tracing is enabled on your API, you will gain insights into the timings for each request and spans for plugins, handlers, and policies. The plugin also supports trace propagation using W3C headers by default, allowing you to trace requests from the client all the way to your backend.
Trace Visualization#
The OpenTelemetry plugin traces the following by default:
-
Request: The entire request lifecycle, including the time taken to process and respond.
-
Inbound Policies: The execution time for all inbound policies and each individual policy.
-
Handler: The request handler’s execution time.
-
Outbound Policies: The execution time for all outbound policies and each individual policy.
-
Subrequests: Any use of fetch within custom policies or handlers.
With Zuplo’s OpenTelemetry plugin, you can significantly enhance your API monitoring capabilities. Start tracing your API requests today and gain deep insights into your system’s performance and behavior. The OpenTelemetry Plugin is available with a Zuplo Enterprise plan. Check out our docs for a step-by-step on how to get started.


